MAI-Thinking-1 技术报告阅读
MAI-Thinking-1 的技术报告标题是 MAI-Thinking-1: Building a Hill-Climbing Machine。
官方还有一个介绍页:Introducing MAI-Thinking-1,以及 MAI-Thinking-1 Model Card。
一句话概括:这篇报告围绕 Microsoft AI 所说的 hill-climbing machine 展开,内容覆盖数据、MoE 架构、训练系统、RL recipe、agent 环境、评测和安全红队,重点是模型能力迭代体系,而不只是单个模型的 benchmark 结果。
MAI-Thinking-1 本身是一个 35B active / 1T total parameter 的 sparse MoE reasoning model。报告强调它是 from scratch 训练的,没有用第三方模型蒸馏;pre-training 使用 30T tokens,数据来自公开和授权的人类生成内容,并且在 pre-training 阶段不使用语言模型生成的 synthetic data。
需要区分的是:报告里说的 “不蒸馏” 主要指不从第三方模型继承能力;RL 阶段内部仍然使用 self-distillation 来恢复或延续 RL climb。
本文主要整理几个点:
- 模型结构:MAI-Base-1 的 MoE、attention、LatentMoE 和 dropless MoE;
- 训练基础设施:YOLO 训练框架、硬件集群、调度和运维;
- Pre-training:scaling ladder、数据 composition 和训练阶段;
- Post-training / RL:RL climb、STEM / agentic / helpfulness-safety 数据与训练;
- Evaluation:benchmark、人类偏好评测和安全评估。
模型结构
MAI-Thinking-1 的 base model 叫 MAI-Base-1,是 decoder-only Transformer + sparse MoE。
几个核心配置:
| 项目 | 报告口径 |
|---|---|
| 模型规模 | 35B active / 1T total |
| 架构 | decoder-only Transformer |
| 层数 | 78 layers |
| FFN | dense FFN 和 MoE 交替 |
| MoE | LatentMoE |
| experts | 512 experts |
| 每 token 激活专家 | top-8 |
| attention | 5 local attention + 1 global attention 周期 |
| local window | 512 |
| GQA | 8 KV heads |
| tokenizer | o200k_base,vocab size 200019 |
| context | mid-training 后扩到 256K |
这个结构主要服务于训练效率、推理效率和大规模训练稳定性。
Attention 部分没有用每层 full attention,而是 5 层 local attention 搭配 1 层 global attention。local attention 用 RoPE,window size 是 512;global attention 不用 position encoding。这样可以降低训练 attention 计算量,也能减少推理时 KV cache 的规模。
FFN 部分采用 dense FFN 和 MoE 交替。它不是 every-layer MoE,而是把高稀疏 MoE 和零稀疏 dense layer 配在一起。报告里的说法是,这种 interleaved layout 在 scaling 上接近更均匀的 medium-sparsity MoE,但 wall-clock 训练效率更好。
MoE 使用 LatentMoE:先共享 down-projection,再做 all-to-all dispatch;routing 仍然基于原始 representation,每个 compressed representation 被路由到 512 个专家中的 8 个。报告将其作为降低专家通信和计算成本的一项设计。
另一个工程细节是 dropless MoE。很多 MoE 实现会设置 expert capacity,超出 capacity 的 token 被 drop。报告里说他们最终收敛到 fully dropless MoE,并支持 variable message size all-to-all 和 bounded memory usage。这个设计与训练稳定性有关:如果 token dropping 存在,routing / load balance 的结果会受到 capacity 设置影响。
训练基础设施
训练基础设施部分主要包括 YOLO 训练框架、底层硬件集群、Kubernetes/Kueue/Ray 调度运行时,以及围绕 goodput 的稳定性和可观测性体系。
YOLO 训练框架
报告里的训练系统叫 YOLO,展开是 You Only Launch Once。
YOLO 是 Microsoft AI 自研的大规模训练框架,基于 PyTorch,覆盖 pre-training、mid-training、SFT 和 RL training。它实现了 model definition、sharding、optimizer、dataloader、checkpointing 等核心训练循环。
报告没有说明 YOLO 与 DeepSpeed 的实现关系;虽然二者都覆盖 ZeRO、MoE、sharding、checkpointing 等大规模训练问题域,但不能据此判断 YOLO 是否复用了 DeepSpeed。
报告列出的训练系统能力包括:
- 自定义 FP8 GEMM、Grouped GEMM、quantization kernels;
- MoE 支持 dropless / capacity-capped、多种 load-balancing 策略、router replay;
- expert dispatch / compute / collect 做 pipeline overlap;
- activation checkpointing + activation offloading;
- bitwise reproducibility;
- checkpoint 保存 model weights、optimizer state、FP8 scaling history、dataloader progress、RNG;
- 把 goodput 当成生产 KPI,而不仅仅是 MFU。
报告里提到 MAI-Base-1 pre-training 在 8K GPUs 上达到 90.0% goodput。goodput 不同于单纯的 MFU,它会受到 crashloop、node failure、link flap、OOM、checkpoint stall、recompute、slow startup、调度延迟、恢复后 MFU 下降等因素影响。
从 infra 角度看,这部分说明报告关注的不只是单步训练吞吐,也包括故障恢复、可复现性、checkpoint 和长周期训练的有效利用率。
报告给出的 goodput 定义是:
1 | goodput = ideal training duration / actual wall-clock duration |
其中 ideal training duration 可以理解为:如果训练过程一直以目标状态稳定 stepping,没有失败、重算、启动等待、checkpoint stall、MFU drop 等 overhead,完成同样训练进度所需的理想时间。actual wall-clock duration 则是实际从训练开始到完成所花的墙钟时间。
也可以按 overhead 分解成:
1 | actual wall-clock duration = ideal training duration + total overhead |
因此:
1 | overhead ratio = 1 - goodput |
MAI-Base-1 的 90.0% goodput 表示:实际消耗的 wall-clock time 中,大约 90% 对应理想训练进度,约 10% 是各种 overhead。报告进一步把 overhead 拆成 recomputation、non-stepping time、MFU drop overhead 等类别。
这个指标和 MFU 的关系是:MFU 衡量 stepping 时 GPU 理论算力被模型计算利用了多少;goodput 衡量端到端训练墙钟时间里有多少真正转化成有效训练进度。因此,一个 run 可以有较高 MFU,但如果频繁失败、重启、重算或 checkpoint 卡住,goodput 仍然会很低。
报告还披露了几组训练系统指标:
- MAI-Base-1 pre-training 在 8K GPUs 上达到 90.0% goodput;
- total overhead 降到 51 hours;
- recomputation 为 6.5 hours,占 overhead 的 15%;
- non-stepping time 为 14 hours,占 overhead 的 27%;
- MFU drop overhead 为 18 hours,占 overhead 的 35%,是最终 run 中最大的剩余 overhead 类别;
- 在架构演进中,早期 GB200 NVL64 设置的 MFU 从 18% 提升到 22%;
- GPU Direct RDMA 约带来 1.1x end-to-end training time 改善;
- 自定义 block-sparse attention backend 约带来 1.06x step time 改善;
- ZeRO-2 相关优化约带来 1.03x end-to-end 改善;
- 自定义 Triton expert encode kernel 将 HBM utilization 从约 10% 提升到约 80%,并带来约 1.03x end-to-end 改善。
推理部署侧,报告称 MAI-Thinking-1 在 MAIA-200 上实现后,相比 GB200-based deployment,在相同 rack power budget 下 token generation throughput 高 40% 以上。这个指标是 performance per watt 口径,不是单卡峰值吞吐。
硬件和集群架构
MAI-Thinking-1 的主训练硬件是 Microsoft Azure 平台内 Microsoft-operated 的单站点 GB200 集群。这个部分的信息主要来自报告正文的 Section 6 Cluster Environment 和 Appendix K Cluster Environment Details;外部链接只用于补充硬件、网络和调度组件背景。
报告没有说明使用了 Azure Machine Learning。它披露的是:MAI-Base-1 在 Azure platform 内的 Microsoft-operated cluster 上,从 8K GB200 GPUs 开始做 from-scratch pre-training;调度和运行时栈包括 Kubernetes、Kueue、MAI control plane、Ray、NCCL 和 YOLO 训练框架。下文按 Azure-based first-party infrastructure 理解。
下图是基于报告文字整理的系统架构示意。

图中 GHR 是 guest health report,指节点内部运行环境上报的健康信息,用于辅助判断节点是否需要进入 vendor maintenance。NPD 是 Kubernetes Node Problem Detector,负责把节点侧异常上报为 Kubernetes node conditions 或 events。admitted job 指已经通过集群准入 / 调度流程,并获得相应计算资源的训练作业。
报告里的硬件口径如下:
| 用途 | 硬件 |
|---|---|
| 主 pre-training run | 8K NVIDIA GB200 GPUs |
| Pre-training / Mid-training 1 | 8,192 GB200 GPUs |
| Mid-training 2 | 4,096 GB200 GPUs |
| 早期原型和实验 | H100 |
| 开发、验证、profiling、下一代 bring-up | H100 / GB200 / GB300 |
| 推理部署优化 | Microsoft MAIA-200 |
GB200 和 GB300 集群部署在 Microsoft first-party datacenters。这里的 first-party datacenters 可理解为 Microsoft 自有或直接运营的 Azure 数据中心资源。
报告还提到,这些集群通过 Azure 团队共同维护的 custom images 暴露给 MAI。从 Appendix K 的 cluster provisioning、node lifecycle、certification 和 telemetry 语境看,这里的 custom images 更像是节点级操作系统镜像,可能包含 OS、GPU driver、RDMA/NCCL 相关组件、诊断与 telemetry agent 等基础软件栈;报告没有明确说明它是 OS image 还是 container image。
主训练被放在一个 single logical cluster、one site 上,主要是为了降低实验方差:同一代 accelerator、稳定 rack health、稳定 scheduler 行为、可预测 storage path。
硬件拓扑上,GB200 / GB300 系统以 rack-scale NVL72 为单位部署:
- 每个 rack 是一个 72-GPU NVLink domain;
- NVLink / NVSwitch 负责 rack 内 scale-up 高带宽通信;
- rack 间 scale-out 通信用 InfiniBand RDMA;
- 为了训练稳定性,报告中实际使用 64 GPUs per rack,即 NVL64,保留 spare capacity 来容忍 node failure 和 unhealthy devices;
- H100 系统仍在 lab 环境里使用,形态是 8-GPU nodes,node-local NVLink/NVSwitch,跨节点 InfiniBand。
可以简化理解为:
1 | GB200 rack / NVL72 |
这个拓扑也影响了模型并行策略。为了提高 GEMM efficiency,MAI-Base-1 选择:
- expert parallelism,EP = 64;
- tensor parallelism,TP = 1;
- expert all-to-all communication 保持在 NVL64 domain 内;
- cross-rack InfiniBand 用于 data parallel communication,比如 parameter all-gather 和 gradient reduce-scatter;
- pre-training 和 mid-training 1 使用 EP=64 + ZeRO-2;
- mid-training 2 启用 ZeRO-3 / FSDP;
- mid-training 阶段使用 context parallelism。
集群切分和逻辑集群
Appendix K 里有一句关键描述:每个 site 会被切分成多个 Kubernetes clusters,通常是一栋 datacenter building 对应一个 Kubernetes cluster。
可以理解为:
1 | physical site / datacenter campus |
这种切分不是说一个训练任务只能在一栋楼里运行,而是把物理基础设施按 building 边界组织成多个 Kubernetes 管理单元。报告同时提到 large jobs 在需要时可以跨越单个 Kubernetes cluster 的边界:nodes are universally routable across the compute environment,workload pods use host networking,以减少 overlay network overhead。
这里的几个层次可以分开看:
| 层次 | 含义 |
|---|---|
| site | 一个物理数据中心站点或数据中心园区 |
| datacenter building | site 内的一栋数据中心楼,通常有自己的电力、冷却、网络和 rack 布局 |
| Kubernetes cluster | 软件层面的资源管理单元,通常按 building 切分 |
| logical cluster | 面向训练和调度暴露的逻辑资源池,包含 GPU nodes 和 CPU support nodes |
| fleet-wide view | 跨 cluster / scheduler backend 的统一可见性和运维视图 |
报告称主训练放在一个 single logical cluster、one site 上,目标是降低实验方差:同一代 accelerator、稳定 rack health、稳定 scheduler 行为、可预测 storage path。这里的 logical cluster 不应直接等同于单个 Kubernetes cluster;Appendix K 同时说明一个 site 通常会按 datacenter building 切分为多个 Kubernetes clusters。因此,8K GB200 是否全部位于同一个 Kubernetes cluster 内,报告没有明确披露。
调度和控制面
控制面和调度架构可以拆成:
- Kubernetes 维护 cluster state;
- Kueue 负责 quota、admission、priority、preemption 和 topology-aware placement;
- MAI cluster-local control plane 管理 reservation、rack topology、quota coherence 和 scheduling-readiness gates;
- Ray 在 admitted jobs 内执行 distributed runtime;
- MAI drivers 把调度得到的 topology 转成 actor placement、communication groups 和 NCCL clique configuration。
这里的 MAI control plane 不是报告中披露的公开 Kubernetes 插件名。按 Appendix K.3 的描述,它更像一组 MAI 内部的 cluster-local controllers:不替代 scheduler,而是维护 scheduler 所需的 reservation、rack topology、quota coherence、scheduling-readiness gates 等状态。是否实现为 Kubernetes CRD/controller、scheduler plugin 或其他内部组件,报告没有进一步披露。
Kueue 负责 admission 和 topology-aware placement。MAI cluster-local control plane 则维护 Kueue / scheduler 做决策所需的状态,例如 rack reservation、topology labels、scheduling-readiness gates。报告特别提到 rack fragmentation 风险:许多小任务如果随机占满不同 rack,会让后续大任务很难拿到连续、拓扑紧凑的容量。为此,cluster-local control plane 会维护 soft rack reservations。队列可以有 preferred racks;空闲时可以借用容量,需要时再通过 reclaimWithinCohort reclaim reserved racks。
Ray runtime 和训练作业
Ray 是 admitted job 内部的 distributed runtime。这里的 admitted job 指已经通过集群准入 / 调度流程,并获得相应计算资源的训练作业。Kueue 完成 admission 和 placement 后,MAI drivers 会把得到的 topology 转成 Ray actor placement、communication groups 和 NCCL clique configuration。
不同类型任务的 actor 需求不同:
- pre-training jobs 主要要求 strict learner availability;
- RL jobs 会包含 learners、inference servers、rollout workers、routers 等多种 actor;
- MAI drivers 负责监控 actor liveness、协调训练循环,并维护异步组件之间的 checkpoint consistency。
这部分和 RL training 尤其相关。RL 不是单一同步训练循环,而是 learner、推理服务、rollout、reward / grader 等多类组件共同工作。报告把 Ray 放在 admitted jobs 内部;按该描述,Ray 的作用范围主要在作业内,用于 actor 编排和运行时管理,集群级排队、准入和资源分配仍由 Kubernetes、Kueue 以及 MAI control plane 等组件承担。
Certification 和节点生命周期
报告强调 physical topology 和 hardware health 是 first-class scheduling state。节点不是 provisioned 就可用,而是要经过 certification。certification 的目的,是防止坏节点、退化链路、边缘状态存储和 silent-corruption 风险进入生产训练池。
certification 分层进行:
| Stage | 检查内容 |
|---|---|
| single-node diagnostics | GPU、CPU cores、HCA、NVLink links、main memory |
| rack-level collectives | 通过 NCCL collectives 检查 rack 内多节点通信和 NVLink / NVSwitch 行为 |
| cross-rack InfiniBand validation | 检查跨 rack、rails、leaf groups、spine-layer path diversity 和 RDMA performance |
节点生命周期见报告 Figure 26:
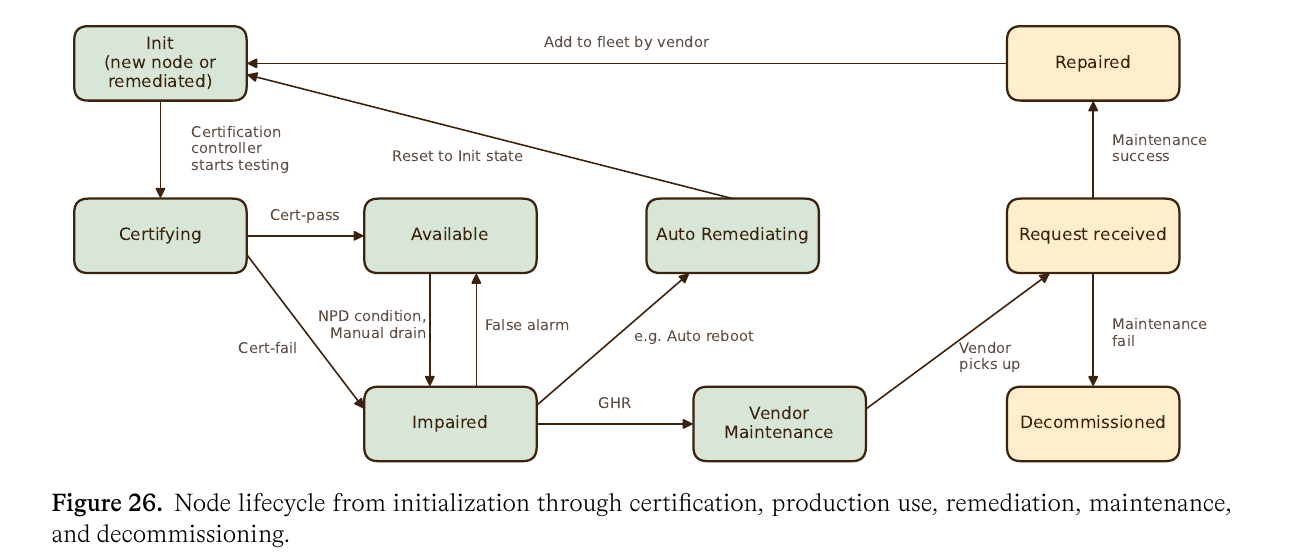
状态迁移可以直接理解为:
- 新节点或修复后的节点先进入
Init,再由 certification controller 进入Certifying; - certification 通过后进入
Available,失败则进入Impaired; Available节点在出现 NPD condition 或 manual drain 后会进入Impaired;- 如果是误报,可以从
Impaired回到Available; - 如果需要自动修复,则从
Impaired进入Auto Remediating,例如 auto reboot、reset 或 soft drain,之后回到Init重新认证; - 如果自动修复不足以解决问题,则通过 GHR 进入
Vendor Maintenance; - vendor 维修成功后进入
Repaired,再回到Init;维修失败则进入Decommissioned。
这里 Impaired 表示节点已被判定为不健康或不适合继续进入生产训练池;Auto Remediating 表示系统先尝试自动修复,例如 reboot、soft drain 或 reset。NPD 是 Kubernetes Node Problem Detector,负责把节点侧异常上报为 Kubernetes node conditions 或 events。GHR 可理解为 guest health report,即节点运行环境内部上报的健康信息,通常来自 guest OS 或节点级 agent,用于补充平台侧硬件健康信号。Runtime monitoring 会根据 NPD conditions、XID errors、ECC thresholds、NVLink degradation、InfiniBand link flaps、storage faults 等信号触发状态迁移。修复后的节点不会直接回到 Available,而是回到 Init 并重新经过 certification。
异常处理时序可以整理成:
sequenceDiagram
participant Telemetry as Telemetry / Runtime Monitoring
participant Controller as Certification / Remediation Controller
participant Scheduler as Scheduler / Kueue
participant Node as Node
participant Vendor as Vendor / Datacenter Maintenance

Telemetry->>Controller: XID / ECC / NVLink / IB / storage fault
Controller->>Scheduler: mark node unschedulable / drain
Controller->>Node: attempt auto remediation

alt transient issue fixed
  Node-->>Controller: reboot / reset / soft drain succeeds
  Controller->>Node: reset to Init
  Controller->>Node: run certification
  Controller->>Scheduler: mark node Available
else persistent hardware issue
  Controller->>Vendor: GHR / guest health report
  Vendor->>Node: repair or replace
  Node-->>Controller: repaired
  Controller->>Node: reset to Init
  Controller->>Node: re-run certification
  Controller->>Scheduler: mark node Available if cert-pass
else maintenance fail
  Vendor->>Controller: maintenance fail
  Controller->>Scheduler: decommission node
end
Telemetry 和 observability
报告把 observability 放进控制回路,而不是只做 dashboard。硬件 telemetry、fabric health、storage behavior、scheduling state 和 job progress 会决定容量是否 admitted、drained、remediated 或 returned to service。
硬件健康信号包括:
- GPU XID;
- ECC;
- thermals、power、clock throttling;
- NVLink state、NVLink bit-error rate、chip-to-chip links;
- InfiniBand device state;
- local NVMe health;
- PCIe errors;
- driver state。
这些信号会转成 Kubernetes node conditions,再进入 scheduling、triage、drain 和 remediation controllers。
作业可观测性则横跨 Kueue、Kubernetes、Ray、training logs 和 experiment metadata。报告提到 operator 可以按 namespace、pod、job、restart index 查看 queue、priority、admission state、node placement、worker readiness、restart count、training configuration、step progress 和 scoped logs。这样可以区分 scheduling delay、runtime failure、node failure、storage degradation 和 application-level stalls。
Telemetry 存储和查询也分层:
| 系统 | 用途 |
|---|---|
| Datadog | near-real-time metrics 和 log search |
| Azure Managed Prometheus | in-cluster / cross-cluster time-series collection |
| Azure Data Explorer | long-retention logs、metrics、storage telemetry、cluster state |
| Azure Monitor | resource 和 Prometheus alerts |
因此,硬件架构不只是 “8K GB200 GPUs”,而是一套围绕 usable training capacity 设计的系统:rack 内 NVLink 负责高带宽局部通信,rack 间 InfiniBand 负责扩展到多 rack;调度器尽量保持 locality;certification 和 telemetry 防止坏节点、坏链路和 silent corruption 进入训练池。
参考信息
本节事实来源主要是 MAI-Thinking-1 技术报告的 Section 6 Cluster Environment 和 Appendix K Cluster Environment Details。下面这些外部链接只作为背景参考,用来解释报告中出现的硬件、网络和调度组件,不作为 MAI 训练细节的独立来源。
| 链接 | 说明 |
|---|---|
| Microsoft Azure | Azure 平台背景 |
| NVIDIA GB200 NVL72 | GB200 / NVL72 硬件形态 |
| NVIDIA GB300 NVL72 | GB300 / NVL72 硬件形态 |
| NVIDIA NVLink | NVLink / NVSwitch 高带宽互联背景 |
| NVIDIA InfiniBand | InfiniBand / RDMA 网络背景 |
| Kubernetes | Kubernetes cluster state 和控制面背景 |
| Kueue | Kubernetes batch queueing、admission 和 quota 管理背景 |
| Ray | distributed runtime 背景 |
| NCCL | GPU collective communication library 背景 |
| Azure Maia | Microsoft Maia 系列背景;报告未披露 MAIA-200 具体芯片规格 |
Pre-training
Pre-training 部分主要整理 scaling ladder、pre-training 数据 composition,以及 pre-training / mid-training 的训练阶段。
Scaling ladder
报告反复强调 scaling ladder:架构和数据决策不只看单个小规模实验,而要看收益能否沿着 scale 稳定成立。
他们用 scaling ladder 做架构和数据消融:对不同 model size,用固定的 tokens per active parameter 训练,比较 scaling curve。多数 architecture ablation 在接近 Chinchilla optimal 的 100-200 TPP 做,而主训练会 over-train 到 500-1000 TPP,让模型更适合高频推理场景。
这个方法的前提是:小模型上的改进不一定能迁移到大模型;某个数据 mixture 在小规模上更好,也不代表在大规模上排序不变。因此,报告把可扩展验证放在 pre-training 决策的中心。
这也是 “hill-climbing machine” 的组成部分:架构、数据和训练系统都通过 ladder + efficiency gain 做评估,以支持持续迭代。
Pre-training 数据
MAI-Base-1 使用 30T tokens 预训练。数据来源包括:
- web HTML;
- web PDFs;
- public GitHub code;
- books and journals;
- academic papers;
- news;
- multilingual text;
- domain-specific materials。
报告披露了几个数据治理口径:
- 不使用 open source training datasets;
- 不使用语言模型生成的 synthetic data 做 pre-training;
- 尽力移除采集源里的 AI-generated content;
- 排除常见机器学习数据站点和仓库,比如 huggingface.co 一类来源;
- 不使用 Microsoft 产品和服务里的 private customer data,除非用户明确 opt in 或适用协议允许;
- 对整个 corpus 做 PII-risk 和 safety filtering。
报告披露的知识截止日期也比较细:
| Source family | Knowledge cut off date |
|---|---|
| Web HTML pages | September 2025 |
| Web PDFs | December 2025 |
| Public GitHub Code | June 2025 |
| Books and journals | March 2026 |
从报告披露看,MAI-Base-1 的 pre-training 数据策略强调 clean、licensed 和 human-generated。
预训练数据 composition 的数字如下:
| Source family | Unique tokens | Training tokens | Mix | Avg. epochs |
|---|---|---|---|---|
| Code | 7.4T | 16.4T | 54.6% | 2.22x |
| STEM | 2.2T | 4.7T | 15.8% | 2.17x |
| Math | 0.3T | 1.6T | 5.4% | 5.28x |
| Books and journals | 0.6T | 0.9T | 3.1% | 1.65x |
| PDFs | 2.7T | 1.4T | 4.7% | 0.53x |
| Web text | 8.1T | 4.5T | 14.9% | 0.55x |
| Multilingual (other) | 8.1T | 0.5T | 1.6% | 0.06x |
| Total | 29.2T | 30.0T | 100.0% | 1.03x |
这里有几个指标比较关键:
- code 占 54.6%,是最大的数据来源;
- STEM + Math 合计 21.2%,并且 Math 的平均采样 epoch 最高,达到 5.28x;
- Web text 和 PDFs 的可用 unique tokens 没有被完整耗尽,平均 epoch 分别是 0.55x 和 0.53x;
- multilingual other 只有 1.6% training mix,但报告说明 domain-specific multilingual data 会被计入其他类别。
mid-training 的数据仍来自 pre-training corpus,不引入新的 synthetic source。报告披露的目标 mixture 是:code 55%,STEM/math 35%,background sources 10%。
训练阶段的规格如下:
| Phase | Tokens | Context length | GB200 GPUs |
|---|---|---|---|
| Pre-training | 30T | 16,384 | 8,192 |
| Mid-training 1 | 3.4T | 65,536 | 8,192 |
| Mid-training 2 | 150B | 262,144 | 4,096 |
也就是说,MAI-Base-1 先在 16K context 上完成 30T tokens 的主预训练,再通过 3.55T tokens 的 mid-training 把 context 扩展到 256K。
Post-training / RL
Post-training / RL 部分包括通用 RL recipe、STEM climb、agentic coding / tool use、helpfulness / safety,以及最后的 consolidation。
RL climb
pre-training 和 mid-training 提供模型预测能力和知识;解题策略、推理 token 分配、工具使用、偏好和安全约束主要在 RL climb 阶段处理。
MAI-Thinking-1 的 RL 从没有 reasoning trace 暴露的 checkpoint 开始,目标是让模型从零发展 reasoning 能力。报告里把稳定 RL 爬坡归因到三个机制:
- 对 GRPO 做两个简单但关键的调整;
- self-distillation,用于 crash 或 base policy 更新后恢复 climb;
- infra 改进,减少 training 和 inference 之间的 numerical mismatch。
他们训练了三个 specialist:
- STEM / competitive code;
- agentic coding / tool use;
- helpfulness / safety。
之后再把这些 specialist consolidation 到单个 MAI-Thinking-1 模型。
GRPO 有两个主要改动。
第一个是 adaptive entropy control。它不是显式加 entropy bonus,而是根据目标 entropy 在线调整 clipping bound。如果 entropy 太低,就放宽上界,让 policy 能更积极地增加 alternative tokens 的概率;如果 entropy 足够高,就收紧 trust region。
第二个是 outer ratio clip。原始 PPO / GRPO 的某些分支在 “往正确方向修正” 时不 clip,但报告发现这些 unclipped branches 会导致 catastrophic gradient-norm spikes,于是加了 hard outer clip。
reward 结构也保持统一:
1 | R = R_task + w_lang * R_lang - w_len * R_len |
也就是 task reward 加语言一致性奖励,再减长度惩罚。语言一致性奖励用于缓解长上下文 RL 中的语言漂移;长度惩罚用于控制 reasoning 长度。
RL 训练的部分超参数也有披露:
- top-p sampling 使用
p = 0.97; - 早期最大 rollout length capped at 8K tokens;
- 随训练推进,rollout length 按 2 的幂次扩展,最终到 128K tokens;
- 在 128K extension stage 移除 length penalty,即
w_len = 0; - problem sampling 设置
G = 128total rollouts,G_early = 16; - early pass-rate filtering 使用
[0.05, 0.8],常规 pass-rate filtering 使用[0.1, 0.8]; - 每次 inference model update 之间做 5 个 gradient steps;
- 超过 8 次 inference updates stale 的 rollout 会被丢弃,也就是最多落后 40 gradient steps;
- RL 阶段 global MoE load balancing coefficient 为
1e-5; - self-distillation SFT 使用 128K sequence length、global batch size 2048、AdamW weight decay 0.001、maximum learning rate
1.7e-5、minimum learning rate5.2e-6、warmup ratio 2%; - self-distillation dropout rate 为 0.15,MoE load balancing coefficient 为
1e-2。
STEM 数据
STEM climb 使用 STEM Mix。报告说他们处理了数百万文档,产出超过 5M samples,其中最难部分超过 550k 个 (q, a) pairs。
这个 pipeline 将 textbooks、academic PDFs、forum discussions、competition archives、vendor problems 等异构来源转成可验证的问答对。
流程包括:
- OCR 和 cleanup;
- 去 boilerplate,规范化文本;
- 构建层级结构;
- LLM 标注 question / answer spans;
- 对分离的题目和答案做 QA pairing;
- 标注题型、topic taxonomy、PII、answer leakage;
- 把选择题、证明题等重写成 open-ended;
- 多 solver pass@k 解题;
- consensus grading;
- difficulty rating;
- 丢掉 faulty ground truth。
这个部分的重点是构造可验证、难度合适、topic 多样且 ground truth 可靠的训练信号。报告把 verifier / grader / data pipeline 作为 STEM RL 数据构造的核心环节。
STEM Mix 的样本分布也有披露。
按原始题型:
| Problem format | Share |
|---|---|
| Open ended | 56.1% |
| Proof | 33.3% |
| MCQ | 10.6% |
按学科 taxonomy:
| Subject | Share |
|---|---|
| Mathematics | 58.5% |
| Physics | 13.2% |
| Chemistry | 10.9% |
| Other | 4.3% |
| Electrical Engineering | 3.4% |
| Computer Science | 2.6% |
| Mechanical Engineering | 2.6% |
| Biology | 1.9% |
| Mechanics of Materials | 1.0% |
| Civil Engineering | 0.9% |
| Economics | 0.7% |
Multiple-choice 和 proof problems 会在 ingestion 过程中转换成 open-ended form;转换不可行的样本会被丢弃,但报告保留了少量 multiple-choice problems,让模型仍然熟悉该格式。
Agentic coding 和 tool use
Agentic climb 训练模型在外部环境里做多步任务:读代码、改文件、跑测试、观察失败、修复方案、再尝试。
报告里的 Sandbox Execution Environment(SEE)会为每个 agentic task 启一个 fresh container,任务完成后销毁。容器默认 network-isolated,以保证可复现,避免 rate limit、外部服务波动等副作用。如果确实需要网络,比如安装包,则通过 caching proxy 和 domain allowlist 管理。
SWE RL problem 会被打包成自包含容器镜像:
- repo checkout 到指定 commit;
- 依赖预装;
- problem statement;
- unit tests / grader;
- Bash tool;
- String replace editor。
模型通过 tool call 和容器交互,结束后 grader 在同一个容器里跑测试并给 reward。
这个设计把 SWE-bench 式任务扩展为可规模化生产的 RL environment。它不是只用于评测的 benchmark,而是用于训练的环境工厂。
tool-use 环境则模拟企业和消费场景中的 API / MCP 交互。每个问题包含 query、tool schemas、initial state 和 grader。有些环境里单个任务可用工具超过 50 个,用来训练模型高效选择合适工具。
他们还会合成 closed-world tool-use environment:生成数据库、tool definition、verifiable task,然后执行和去重。这里 synthetic data 用在 RL / tool-use 环境构造上,而不是 pre-training。
Helpfulness 和 safety
报告把 helpfulness 和 safety 放在同一个 RL 框架里,而不是把 safety 当成模型发布前的独立补丁。
一个重点是 reward aggregation。很多目标的 reward scale 不同,简单相加会导致大尺度信号压过小尺度信号;而安全这类目标又不能被 response quality 抵消。报告里用了两种策略:
- lexicographic reward shaping:高优先级 reward 打平时,低优先级 reward 才起作用;
- gated reward application:高优先级目标达到最低要求后,低优先级 reward 才应用。
比如安全属于 gated case:unsafe response 直接拿最低 reward,不再因为 response quality 较高而得到补偿。
另一个细节是风格训练。报告里的目标风格包括 warmth without sycophancy、scannable structure、tone calibrated to context、避免冗长开场等。这部分属于 post-training 中面向可用性的训练目标。
Consolidation
三个 specialist 最后要合到一个模型。报告给了 consolidation SFT 的数据 mixture:
| Capability | Sample weight | Token weight |
|---|---|---|
| STEM and Coding | 56% | 89% |
| Agentic Capability | 11% | 9% |
| General Helpfulness and Safety | 33% | 2% |
这个表显示:general helpfulness / safety 的 sample weight 很高,但 token weight 很低;STEM and Coding 的 token weight 极高。这说明 STEM / code 样本单条更长,尤其 reasoning 和 agentic 轨迹会消耗大量 token。
从 token weight 看,推理模型训练不能只看样本数,还需要看 token budget 和 rollout 长度。
评测
报告里的 STEM 和 agentic coding public benchmark 指标如下。MAI-Thinking-1 的结果是 4 runs average,统一使用 temperature = 1、top-p = 0.97;agentic coding 使用 256K total context length,其他表内 eval 使用 maximum output tokens 256K。
| Benchmark | MAI-Thinking-1 | Sonnet 4.6 | Opus 4.6 | GPT 5.4 | Kimi K2.6 | DeepSeek V3.2 | DeepSeek V4 | GLM-5.1 |
|---|---|---|---|---|---|---|---|---|
| AIME 2025 | 97.0 | 95.6 | 99.8 | - | - | 93.1 | - | - |
| AIME 2026 | 94.5 | - | - | - | 96.4 | - | - | 95.3 |
| HMMT Feb 2026 | 84.9 | - | - | - | 92.7 | - | 95.2 | 82.6 |
| GPQA Diamond | 84.2 | 89.9 | 91.3 | 92.8 | 90.5 | 82.4 | 90.1 | 86.2 |
| LCB v6 | 87.7 | - | - | - | 89.6 | 83.3 | 93.5 | - |
| Terminal-Bench 2.0 | 46.0 | 59.1 | 65.4 | 75.1 | 66.7 | 46.4 | 67.9 | 69.0 |
| SWE-bench Verified | 73.5 | 79.6 | 80.8 | - | 80.2 | 73.1 | 80.6 | - |
| SWE-Bench Pro | 52.8 | - | 53.4 | 57.7 | 58.6 | - | 55.4 | 58.4 |
报告中的结果显示,MAI-Thinking-1 在 broad set of benchmark categories 上表现较强,但不是所有任务都领先。比如 Terminal-Bench 2.0 低于 GPT 5.4、Opus 4.6、Kimi K2.6、DeepSeek V4 等;SWE-Bench Pro 接近 Opus 4.6,但低于 GPT 5.4 / Kimi K2.6 / DeepSeek V4 / GLM-5.1。
因此,从报告自身呈现看,MAI-Thinking-1 的定位不是所有 benchmark 的绝对 top-1,而是一个强调自研训练体系、可部署性和持续迭代能力的 reasoning model。
其他 public benchmark 指标如下,Sonnet 4.6 是报告作者在自有 evaluation suite 中生成的结果:
| Category | Benchmark | MAI-Thinking-1 | Sonnet 4.6 |
|---|---|---|---|
| Knowledge | MMLU Pro | 85 | 87 |
| Knowledge | SimpleQA Verified | 31 | 29 |
| Instruction Following | IF Bench | 69 | 50 |
| Instruction Following | Adv. IF | 85 | 86 |
| Instruction Following | Multi-Challenge | 53 | 57 |
| Long Context | GraphWalks <=128k | 90 | 96 |
| Tool Calling | BFCL v3 | 72 | 76 |
| Safety | AIR-Bench | 88 | 88 |
| Safety | CyberSec Instruct | 63 | 62 |
| Safety | CyberSec Auto | 63 | 56 |
| Honesty | Long Fact | 98 | 98 |
| Honesty | Truthful QA | 88 | 88 |
| Health | HealthBench Prof. | 35 | 38 |
| Health | MedXpert QA | 43 | 49 |
这张表的对比对象比 Table 11 少,原因是很多实验室没有在 model card 或 announcement 里报告这些 benchmark。报告因此只给了 Sonnet 4.6 作为 baseline。
官方介绍页和报告还给出人类 side-by-side evaluation。最终 evaluation set 包含 1276 个英文任务,其中 30% 是 multi-turn。任务来源包括 expert-authored prompts 和经过 PII 过滤的 Microsoft consumer Copilot logs。评估由 Surge AI 管理的 native English raters 完成。
任务分布如下:
| Task category | Share of prompts |
|---|---|
| Open QA | 13-14% |
| Brainstorming and advising | 13-14% |
| Content authoring | 13-14% |
| Structured problem-solving | 6-7% |
| Information extraction | 6-7% |
| Academic help | 6-7% |
| Insight generation | 6-7% |
| Content summarization | 6-7% |
| Task planning | 5% |
| Context-based QA | 5% |
| Other text analysis | 5% |
| Personal support | 3-4% |
| Entertainment | 3-4% |
| Chit-chat | 3-4% |
| Role-play | 3-4% |
Human eval 结果:
| Metric | vs Sonnet 4.6 | vs Opus 4.6 |
|---|---|---|
| Overall side-by-side preference | 0.07 ± 0.06 | -0.07 ± 0.06 |
| Instruction following delta | -0.01 ± 0.02 | -0.04 ± 0.02 |
| Factuality delta | -0.02 ± 0.02 | -0.03 ± 0.02 |
| Conciseness and relevance delta | 0.11 ± 0.02 | 0.07 ± 0.02 |
| Completeness delta | -0.01 ± 0.02 | -0.02 ± 0.02 |
| Style and tone delta | 0.08 ± 0.02 | 0.05 ± 0.02 |
整体胜负比例:
| Comparison | Win | Tie | Loss |
|---|---|---|---|
| MAI-Thinking-1 vs Sonnet 4.6 | 49% | 6% | 45% |
| MAI-Thinking-1 vs Opus 4.6 | 43% | 5% | 52% |
也就是说,人类偏好评测中,MAI-Thinking-1 相对 Sonnet 4.6 略占优;相对 Opus 4.6 略落后。分项上,它相对 Sonnet 4.6 的主要优势来自 conciseness/relevance 和 style/tone;instruction following、factuality、completeness 大致在噪声范围内。
安全侧,报告披露了两个内部指标方向:
- safety / over-refusal:低风险 prompt 计算 over-refusal rate,helpfulness 报告为
1 - over-refusal rate;高敏感 item 用 1-5 Likert safety judge,score > 3视为 safety pass; - jailbreak:从 vendor、internal red-teaming、HarmBench、StrongREJECT 等来源收集 2.5K unique seed scenarios,再增强成约 9.5K jailbreak prompts;指标是 attack success rate,越低越好。
报告没有在正文文本中给出 safety figure 的逐项数值表,但描述称 MAI-Thinking-1 在 8 个类别中的 5 个相对 Sonnet 4.6 更好或相当,较大提升出现在 CBRN、Self Harm、Elections & Politics;jailbreak ASR 与 Sonnet 4.6 和 Opus 4.6 comparable。
总结与启发
这篇报告的核心关键词是 machine。
报告并不只围绕某个单点技术展开,例如 attention、experts、tokens 或 benchmark 分数;它更强调模型开发体系,即如何把数据、模型、训练、RL、环境和评测组织成持续迭代流程。
这个体系可以拆成几层:
- 数据层:干净、授权、人类生成、可治理;
- 模型层:MoE + local/global attention + LatentMoE,为训练和推理效率服务;
- 实验层:scaling ladder + efficiency gain,避免小规模幻觉;
- 训练层:YOLO、determinism、dropless MoE、goodput;
- RL 层:稳定 GRPO、reward shaping、self-distillation;
- 环境层:SEE、SWE container、tool-use closed-world environment;
- 产品层:helpfulness、安全、style、instruction following;
- 评测层:public benchmark、人类偏好、安全红队。
从训练基础设施视角看,有几个启发比较明确。
第一,训练基础设施需要有明确的目标指标。报告把 goodput 放在生产 KPI 位置,而不只看 MFU 或单步吞吐。对长周期训练来说,节点故障、调度等待、重启、checkpoint 恢复、storage 抖动和通信退化都会进入 wall-clock 成本;因此,基础设施目标应更接近 实际有效训练时间 / 总 wall-clock 时间,而不是单点硬件利用率。
第二,调度系统需要理解硬件拓扑。GB200 这类 rack-scale 系统不是一组同质 GPU 池;NVLink domain、rack boundary、InfiniBand path、reserved spare capacity 都会影响训练稳定性和通信成本。Kubernetes / Kueue / MAI control plane 的价值不只是把 Pod 调起来,而是把 quota、reservation、rack locality 和 topology-aware placement 组织成可持续运行的大作业调度能力。
第三,健康检查和 remediation 要进入调度控制回路。报告中的 certification、NPD conditions、GHR、telemetry、drain、auto remediation 和 recertification 共同决定节点能否进入生产训练池。对训练基础设施来说,坏节点、退化链路和边缘状态存储如果只靠人工排查,会直接降低 goodput;更合理的做法是把健康信号转成可调度状态,并让修复后的节点重新经过 certification。
第四,训练框架和集群控制面需要边界清晰。Kubernetes / Kueue / MAI control plane 负责资源准入、拓扑放置和节点状态;Ray 主要在 admitted job 内部承担 actor 编排和 runtime 管理;YOLO 负责训练循环、sharding、optimizer、checkpoint 和 MoE 相关优化。这个分层可以减少职责混杂,也便于分别优化调度效率、作业恢复和训练性能。
第五,RL 环境越来越接近生产系统。它不是离线数据集,也不是简单 judge,而是一批可执行、可复现、可评分、可并发调度的任务环境。持续构造这样的环境,是获得高质量训练信号的重要条件。因此,训练基础设施不仅要支持 GPU 大作业,也要支持容器化任务环境、工具调用、reward / grader、rollout 和 learner 之间的复杂编排。
第六,可复现和可恢复能力会影响模型迭代速度。报告强调 determinism、checkpoint/restart、dataloader progress、RNG、FP8 scaling history 等状态保存。对于大模型训练,这些能力不只是工程洁癖,而是缩短故障恢复时间、降低实验方差、复盘训练异常和稳定推进 RL climb 的基础条件。
因此,这篇报告可以看成 Microsoft AI 对其自有模型训练体系的一次系统披露:从数据、训练系统、RL 环境到产品评测,形成一个面向 reasoning model 的迭代 loop。
报告仍有不少未披露的部分:比如完整数据来源、各阶段 token / compute budget、更细的 RL rollout 规模、reward model 细节、agentic environment 的实际数量、human eval 的完整 prompt 分布等。这些信息会影响外部读者对 hill-climbing machine 长期效率的判断。
总体看,MAI-Thinking-1 的技术意义不仅在于单次 benchmark 表现,也在于 Microsoft 是否能够把 from-scratch pretraining + 自研 RL infra + 企业场景环境 + Foundry 分发 串成稳定迭代系统。后续 MAI 系列的迭代速度和能力边界,需要继续结合模型发布、评测结果和实际产品表现观察。